A survey statistic is worth citing when a reader can understand who was asked, what they were asked and how the result was calculated. A large sample number or an attractive chart cannot supply those missing details. Publish the evidence behind the headline alongside the headline itself.
This reference, reviewed September 14, 2026, applies research-disclosure principles to survey-based content. Its checklist is a publication diagnostic for marketers and editors. We did not conduct a survey or measure backlink outcomes, and the checklist is not a Google ranking requirement.
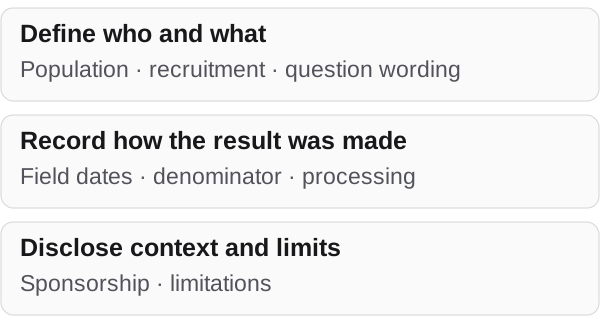
- 01Define the population honestly.Respondents from a newsletter or customer list are not automatically representative of an industry.
- 02Keep the denominator visible.A percentage needs the relevant response count and an explanation of exclusions or multiple-answer questions.
- 03Publish the method with the result.Question wording, dates and recruitment details make a statistic inspectable instead of merely quotable.
01 — Practical guidanceStart with the claim you want another writer to make
Write the proposed headline in a plain sentence, then ask what population it describes. If the data came from customers who chose to answer an email, the supported claim may be about those respondents. Rewriting it as a statement about all businesses requires evidence the sampling design may not provide.
AAPOR’s disclosure standards call for enough information to allow research claims to be reviewed, including recruitment, instruments, field dates and processing. The principle is useful for content teams: the method is part of the publication, not a private explanation supplied only after someone challenges the statistic.
A strong research article can still have a narrow population. A clearly described customer survey may be valuable to a relevant reader. The weakness is not necessarily its size; it is an unsupported leap from a specific group to a much broader one.
02 — Practical guidanceThe publication-readiness checklist
Use the table to inspect the evidence package before an editor approves the claim. A missing item is a question to resolve, not a reason to manufacture a methodological detail. Record unknowns and narrow or remove claims that depend on them.
The checklist is an editorial adaptation of disclosure principles, not a reproduction of every AAPOR requirement. Formal research projects should use the standards relevant to their design. The point here is to make ordinary survey-based content more transparent and easier to verify.
| Disclosure | Question to answer | Publication evidence |
|---|---|---|
| Population | Who does the claim describe? | Eligibility criteria, geography and relevant boundaries. |
| Recruitment | How were respondents selected and invited? | Sample source, recruitment method and incentives. |
| Instrument | What exact question and options produced the result? | Question wording, order and response choices. |
| Field dates | When were answers collected? | Start/end dates and material context changes. |
| Denominator | Which answers are included in each percentage? | Base count, missing answers and multiple-choice rules. |
| Processing | What was removed, recoded or weighted? | Exclusions, duplicate checks and transformations. |
| Sponsorship | Who commissioned and conducted the work? | Named sponsor, researcher and material interests. |
| Limitations | What can the design not establish? | Coverage, selection effects and uncertainty. |
03 — Practical guidanceA denominator can change the meaning of the headline
Consider a synthetic example: 200 people respond to a survey, but only 120 answer the question about a particular tool. If 60 of those 120 choose an option, the result is 50% of people who answered that question, not 50% of all 200 respondents. The example uses invented numbers solely to explain the calculation.
If a question allows multiple selections, percentages may add to more than 100%. Explain that design instead of forcing the chart into a single-choice format. If an analysis excludes respondents, disclose the exclusion and use the correct base for each result.
Do not ask an AI writing assistant to smooth away these qualifications for a cleaner headline. Give it the exact base, population and question wording, then verify that the title, description and chart caption preserve them. The AI fact-preservation guide addresses this risk when content is revised later.
04 — Practical guidanceA sample count is not a guarantee of representativeness
A large voluntary response can still miss important groups. Customers who are unusually satisfied or dissatisfied may be more likely to reply; a professional newsletter may reach a different audience from the full industry. Describe the recruitment mechanism rather than assuming that a larger count removes selection effects.
AAPOR’s survey research best practices distinguish sampling approaches and emphasise transparency. Do not attach a conventional margin of sampling error to a non-probability survey without a justified method and the required assumptions. A precise-looking interval cannot repair an undisclosed design.
For content production, the practical choice is often to narrow the claim. “Among respondents to our customer survey” can be both useful and accurate. “Half of all companies” may be more dramatic but unsupported. The publication should make that difference visible without burying it in a footnote.
05 — Practical guidancePackage the research so it can be checked and maintained
Give the report a stable page with a concise method summary, the exact question behind each headline statistic and a downloadable table of publishable aggregate results. Do not publish personal responses merely to demonstrate transparency. Aggregation and disclosure review are separate responsibilities.
When a result changes, record what changed and why. A correction to a denominator should update the headline, chart, summary and download together. Keep version dates visible so another writer can tell which result they used. Our source-conflict guide explains how to handle conflicting versions of a claim.
A research-led content programme should judge the asset first by whether it answers a real question with inspectable evidence. Backlinks may follow, but they are not guaranteed by a checklist, a sample size or a claims-heavy title. Publish a result a careful editor can use without guessing what it means.
Make a survey result traceable
Download the reference table (CSV). The download contains the rows shown above, with their scope and review date. It does not contain campaign results or a completed assessment of your business.
The source-independence reference helps distinguish original findings from repeated coverage when checking the research against outside sources.
Evidence and scope
- As-of date
- September 14, 2026. Sources reviewed for this article; the editorial allocation is September 13, 2026.
- Method
- Eight original publication checks adapted from AAPOR disclosure principles and survey best practices. One synthetic percentage example; no respondents, original survey findings or backlink measurements.
- Limits
- Not a substitute for a study-specific research design. No representativeness, causal finding or SEO ranking benefit is established by completing the checklist.
06 — Next stepMake the headline traceable to the method
Make the headline traceable to the method
Before publishing a survey claim, make its population, question and denominator easy to inspect. Keep limitations where they affect interpretation and update every representation when a finding changes. That gives a citing writer a reliable reference rather than a statistic that needs reconstruction.